The consensus read on American consumer spending is that households are holding up well despite inflation, pointing to a 2.1% real year-on-year gain in July as evidence of resilience. That number is real. What it obscures is a structural shift in where the money is actually going, one that healthcare services consumer spending data now makes very difficult to wave away.
Healthcare Has Already Lapped Housing, and the Gap Is Widening
According to the Bureau of Economic Analysis, healthcare services (health insurance included, pharmaceutical products excluded) accounted for 18.2% of total consumer spending in July, expressed in inflation-adjusted 2017 dollars at an annual rate. Housing and utilities came in at 16.2%. Combined, the two categories account for over one-third of everything Americans spend. Healthcare surpassed housing as the top spending category three years ago, and the gap has kept widening since.
The month-on-month and year-on-year figures underline the trajectory. Healthcare services rose 0.41% in July from June and 4.2% year-on-year after adjusting for price changes in those specific services. Housing and utilities grew 0.15% monthly and just 1.2% year-on-year. In real terms, healthcare is compounding faster than any other major services category, including financial services and insurance, which came in at 2.9% year-on-year.
The macro picture confirms the trend. According to Health System Tracker, health spending as a share of GDP reached 18.0% in 2024, up from 17.7% in 2023. Health spending per capita increased by 6.1% in 2024, a deceleration from 6.5% in 2023, but still well above the 4.2% recorded in 2022. The direction has not changed; only the speed of acceleration has moderated slightly.
Health System Tracker also breaks down where within the system that money concentrates: hospital spending represented close to a third of overall health spending in 2024, at 31.0%, while physicians and clinics accounted for a further 21.0%. Those two sub-categories alone command more than half of all health expenditure in the country, and neither is known for its price flexibility.
The Recreational Goods Reversal That Changes the Durable Goods Story
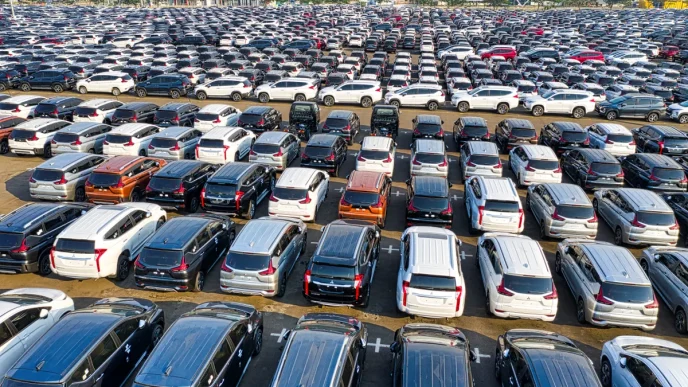
Away from services, the big development in durable goods is a reversal the popular resilience narrative has not fully absorbed. Recreational goods and vehicles, motorhomes, ATVs, video and audio equipment, computers used for entertainment, bicycles, hunting and camping gear, surpassed motor vehicles as the top durable goods category in inflation-adjusted terms in 2021. At the peak late last year, they accounted for over 5% of total consumer spending.
That peak is now clearly in. Inflation-adjusted spending on recreational goods and vehicles fell 5.5% from the November peak through July, including a 1.4% plunge in July alone. Year-on-year, the category is down 1.1%. For context, motor vehicles are roughly flat over the same period, up just 0.3% year-on-year after adjusting for price changes, while furnishings and household equipment rose 4.3% year-on-year. The recreational goods splurge, which was a defining feature of pandemic-era spending, looks to have run its course.
Durable goods overall fell 1.4% in July on a monthly basis, though the year-on-year reading remains up 1.0%. The monthly data is volatile, so one month is not a thesis. But the recreational goods reversal is not one month: it is a trend running since November.
Nondurable goods spending dipped 0.2% monthly in July and rose 1.4% year-on-year. Gasoline spending, adjusted for gasoline price changes, was slightly negative, consistent with a longer trend. Gasoline consumption, measured in million barrels per day, peaked in 2018 and has since fallen by 4.5%, a trend the report attributes to improved fuel efficiency in internal combustion engine vehicles and a growing share of electric vehicles in the national fleet.
The overall spending split for July: 66% on services, 21% on nondurable goods, and 13% on durable goods. Nominal consumer spending rose 5.9% year-on-year in July, against inflation running at 3.7% year-on-year, leaving the 2.1% real gain that the headlines led with. What the headlines did not lead with is that healthcare services consumer spending is the engine pulling most of that services growth, and that the engine shows no sign of slowing, even as the pandemic-era recreational goods boom quietly deflates. Wolf Richter’s full breakdown is available at Wolf Street.