The consensus read on US data centre construction spending is that the numbers are extraordinary and the trajectory is inexorable. Both of those things may be true. What the headline figures obscure, however, is that the construction costs being celebrated are, in the words of the underlying Census Bureau data, the cheap part of the buildout, and that the sector drawing far less attention continues to outspend data centres by nearly double.
What the $85 Billion Figure Does and Does Not Capture
Construction spending on US data centres hit a seasonally adjusted annual rate of $85 billion in August, up 7.5% from July and up 73% year-over-year, according to the US Census Bureau. Since the beginning of 2021, the annual rate has increased by 823%. Those numbers are, on their face, arresting.
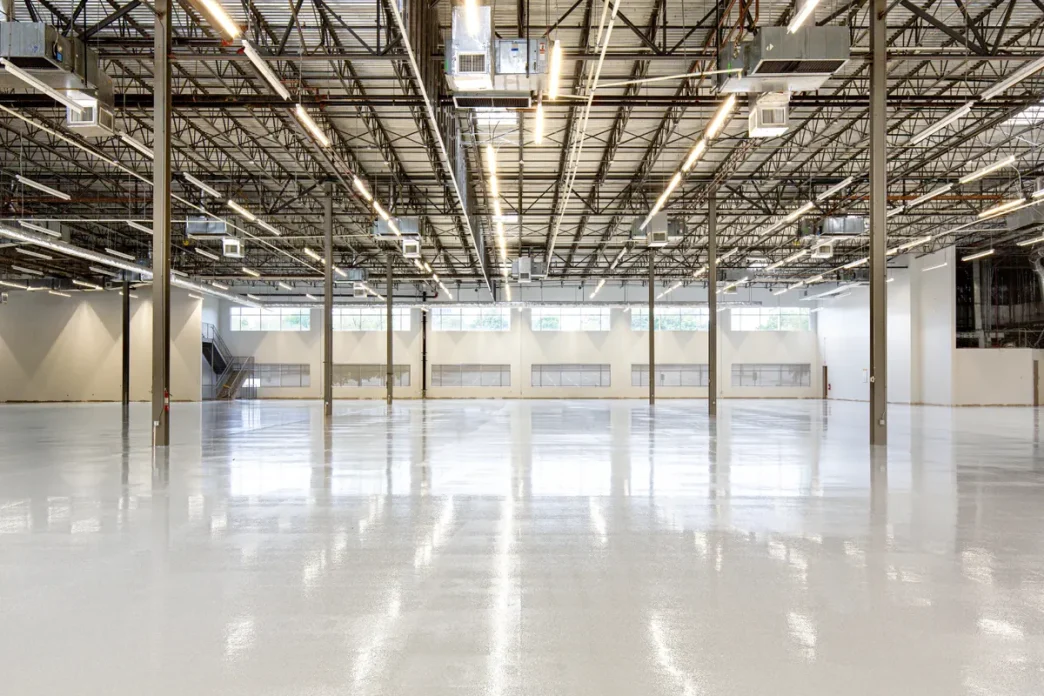
But the Census methodology covers only the physical building shell, the surrounding site improvements, and equipment integrated into the structure, such as HVAC systems. Not included are the servers, racks, optical interconnects, and the electrical infrastructure that actually powers the compute. That equipment, the part that makes a data centre a data centre rather than a large, air-conditioned shed, is the expensive part. The construction figures being cited across financial media are, structurally, an undercount of the real capital deployed.
The scale of individual projects is shifting fast. According to MLQ News, average project cost has surged to $475 million over the trailing 12 months, up from $177.9 million the year prior, reflecting a pronounced shift toward hyperscale campuses rather than the mid-tier facilities that characterised earlier cycles. That is not incremental growth in project size; it is a structural change in the kind of asset being built.
Tom’s Hardware puts the office-market displacement in starker terms: data centre buildouts now represent roughly 63% of all private office construction, and the gap between general office and data centre spending, at $39.1 billion, is the widest recorded in the Census series, which begins in January 2014. The commercial property market is being quietly restructured by a spending wave that most property commentators have not yet fully absorbed.
US Data Centre Construction Spending Versus the Factory Sector Nobody Is Discussing
The more pressing oversight in current coverage, though, concerns manufacturing. Factory construction spending ran at an annual rate of $168 billion in August, unchanged from July and down 19.8% year-over-year, but still 126% above the average it posted over the six-year period 2015-2020. The data centre boom is getting the column inches. The sector actually spending twice as much is barely registering.
Factory construction spending figures carry the same methodological caveat as data centre figures, in reverse: production equipment inside the building, industrial robots, semiconductor fabrication systems and the like, is excluded from the Census count. Those costs can dwarf the building itself. Which means the real capital commitment to domestic manufacturing is also being systematically understated in the figures that inform most of the coverage.
The long-run economic argument for factories is also different in kind from data centres. A completed factory contributes to production and employment for decades. The construction phase is the preamble, not the story. Data centre construction, by contrast, tends to attract coverage as if completing the building is the destination, when the equipment spend that follows is both larger and more consequential for the supply chain.
Meanwhile, power sector construction spending reached an annual rate of $186 billion in August, up 8.5% year-over-year and up 58% since early 2021. Crucially, this figure does include the cost of power generation equipment, making it more directly comparable to the full cost of a data centre than the building-only data centre figure is.
Against all of this, construction companies are now absorbing a second wave of input inflation. The Producer Price Index for construction materials, covering steel mill products, concrete, lumber and gypsum, spiked 10.1% year-over-year in August and 15.8% since the beginning of 2025. The PPI for nonresidential construction services was up 9.4% year-over-year and 11.8% over the same period. The cost of building the boom is rising sharply even as the boom continues.
According to ConstructConnect, year-to-date spending through June already stands at $81.5 billion, surpassing the full-year total of $72.5 billion from 2025 and running at more than three times the 2024 full-year total. The pace is not slowing. The question the data poses (and which the consensus narrative has not seriously engaged) is whether construction cost inflation running at 10-15% will eventually force a reckoning with project economics that the current whatever-it-takes posture has so far deferred.