The consensus reading of the May CPI report treats it as an unpleasant but manageable overshoot. The data underneath that reading suggests the bond market is making a structural error, and that US supercore inflation in May is the clearest evidence of it.
The all-items CPI rose by 0.47% seasonally adjusted in May from April, equivalent to a 5.6% annualised rate, according to data from the Bureau of Labor Statistics. Year-over-year, the all-items CPI jumped by 4.25%, the worst reading since April 2023. That figure has now blown past the Federal Reserve’s policy rate corridor of 3.5% to 3.75%, the 2-year Treasury yield of 4.16%, and the 3-year Treasury yield of 4.21%. All three have turned negative in real terms. The 10-year Treasury yield sits at 4.55%, leaving a spread of just 30 basis points between it and CPI inflation, a gap that implies the bond market still believes a portion of this inflation will prove transitory.
It may not.
US Supercore Inflation May: The Indicator Powell Once Leaned On Has Turned
The component that warrants the most attention is the one the Fed itself elevated, then quietly set aside. When housing inflation was running hot, Powell pointed to supercore services (core services excluding rent and owners’ equivalent of rent (OER)) as the forward-looking gauge for where inflation was headed. At the time, supercore was cooling and he used that cooling to justify rate cuts. Now the dynamic has reversed. The supercore services CPI spiked by 0.55% in May from April, equivalent to 6.8% annualised, the worst month-to-month increase since March 2024. The six-month annualised rate for supercore has accelerated to 4.3%. The indicator Powell once cited as reassuring is now running in the wrong direction, and it has been doing so since last autumn.
Housing components, by contrast, are providing cover. OER rose by 0.30% in May and the rent CPI by 0.36%, both within ranges that broadly prevailed before the pandemic. OER carries a 25.9% weight in the all-items CPI; combined with rent of primary residence at 7.7%, housing accounts for 33.6% of the index. That weighting means subdued housing readings suppress the headline figure even as services inflation elsewhere accelerates. The consensus may be overweighting the housing softness as a signal of broader disinflation.
Electricity and the AI Demand Problem That Households Are Now Paying For
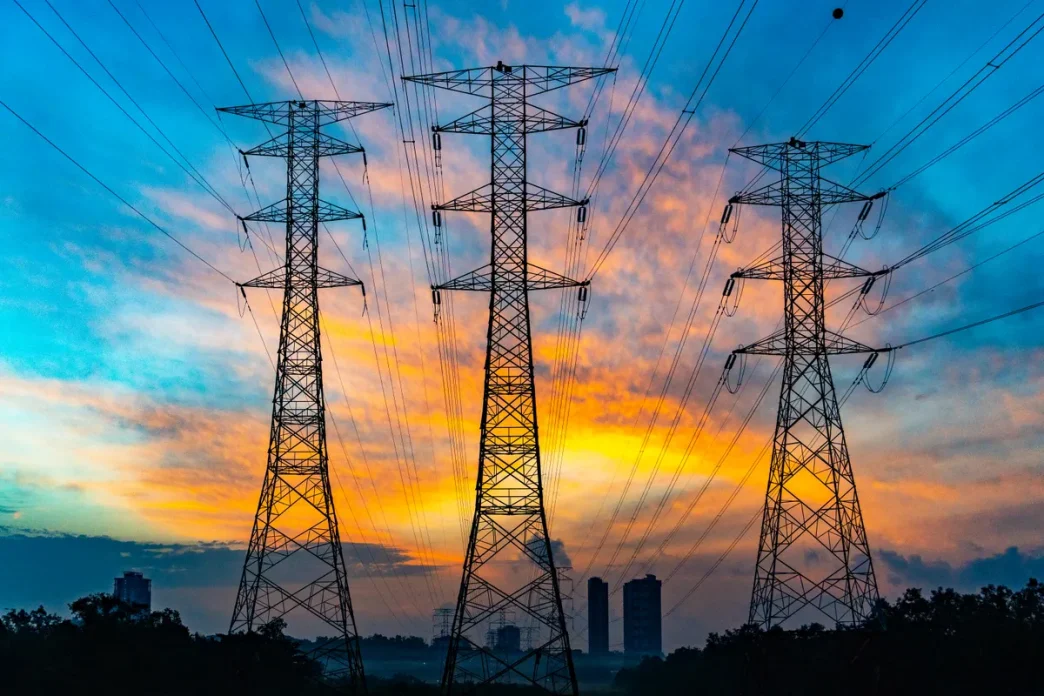
The energy side of the ledger is where the structural argument becomes harder to dismiss. The CPI for electricity spiked 5.9% year-over-year in May, and since the beginning of 2021, the electricity CPI has surged by 43%. Unlike gasoline, electricity prices for households do not retreat after spikes: increases are, as a practical matter, permanent.
The driver is well-documented but still underweighted in mainstream inflation commentary. Data centre demand has been pressuring the grid for years, and the AI buildout has sharpened that pressure considerably. According to research published on arXiv, McKinsey projects US data centre load will rise from 25 GW in 2024 to over 80 GW by 2030, driven predominantly by AI workloads. The same research notes that US data centre energy consumption reached 176 TWh in 2023, representing 4.4% of total US electricity, and is projected to reach 325 to 580 TWh by 2028. Deloitte estimates that AI data centre power demand in the United States could grow more than thirtyfold by 2035, reaching 123 GW from 4 GW in 2024.
The grid stress is not theoretical. In July 2024, a voltage fluctuation in northern Virginia triggered the simultaneous disconnection of 60 data centres, producing a 1,500 MW power surplus that forced emergency adjustments to prevent cascading outages, according to the Belfer Center. Demand from data centres has been increasing faster than new generation capacity can be brought online, and that supply-demand gap feeds directly into household electricity bills. The mechanism is structural, not cyclical, which is precisely the kind of inflation the “transitory” framing fails to account for.
Gasoline added its own pressure: the gasoline CPI rose 7.0% in May on a seasonally adjusted basis and 40.5% year-over-year, approaching the price level seen at the peak of the 2022 inflation spike. Core goods, by contrast, dipped 0.1% in May, providing marginal relief. The core CPI overall rose 0.21% in May and accelerated to 2.9% year-over-year, its third consecutive month of acceleration.
The 30-basis-point spread between the 10-year Treasury yield and CPI inflation is the market’s implicit bet that this bout fades. The supercore trend, the electricity demand trajectory, and the reversal of the very indicator the Fed once used to justify easing all point in a different direction. That bet is getting thinner by the month.